- Analytics
- Technical Analysis
Exxon Stocks Technical Analysis - Exxon Stocks Trading: 2017-12-05
A correction is possible in the oil market
In this review, we suggest considering the personal composite instrument (PCI) "Exxon Mobil Stocks versus BRENT Oil". It reflects the price change dynamics of stocks of the American Exxon Mobil Corporation against the Brent oil deliverable futures. Will the XOM_Brent quotes increase?
This may happen in case of an outpacing increase in the value of Exxon Mobil stocks in comparison with oil quotes. It may be contributed by the company’s positive earnings report. ExxonMobil's net profit according to the 9-month results of 2017 increased by 1.8 times compared to the same period of 2016 reaching $11.33 bln. In the Q3 of 2017, the growth in hydrocarbon production was only 1.8% in comparison with the Q3 of 2016, and the net profit increased by 1.5 times to $3.97 bln. ExxonMobil's quarterly revenue was the highest in 2 years and amounted to $64.4 bln. It should be noted that the company's plans to merge refining and marketing divisions into a separate company- ExxonMobil Fuels & Lubricants Company, are a certain risk for the PCI XOM_Brent. However, this may have already been accounted by the market. Since early 2017, the ExxonMobil stocks have dropped by 7.5%, while the Dow Jones Industrial Average index, in which they are included, has increased by 22.6% over the same period. It should be noted that Brent oil may well correct down after the OPEC decision to extend the output cut in accordance with traders’ "buy rally, sell fact" saying. From a fundamental point of view, a significant increase in the US production contributes to the decline in oil quotes. At current prices, the development of the US shale fields is becoming more attractive.
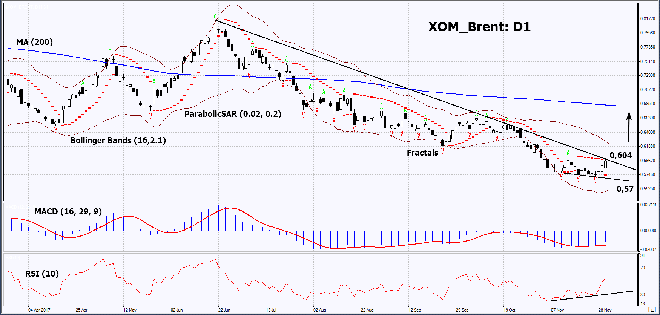
On the daily timeframe, XOM_Brent: D1 has approached the resistance line of the downtrend. Naturally, it has to exceed the resistance line before opening a Buy position. The further price increase is possible in case of the correction of oil quotes and positive information by ExxonMobil company.
- The Parabolic indicator gives a bullish signal.
- The Bollinger bands are narrowing, which means lower volatility.
- The RSI indicator is above 50. It has formed a positive divergence.
- The MACD indicator gives a bullish signal.
The bullish momentum may develop in case XOM_Brent exceeds the last fractal high at 0.604. This level may serve as an entry point. The initial stop loss may be placed below the last fractal low, the Parabolic signal and the 2.5-year low at 0.57. After opening the pending order, we shall move the stop to the next fractal low following the Bollinger and Parabolic signals. Thus, we are changing the potential profit/loss to the breakeven point. More risk-averse traders may switch to the 4-hour chart after the trade and place there a stop loss moving it in the direction of the trade. If the price meets the stop level at 0.57 without reaching the order at 0.604, we recommend cancelling the position: the market sustains internal changes that were not taken into account.
Summary of technical analysis
| Position | Buy |
| Buy stop | above 0,604 |
| Stop loss | below 0,57 |
- Get Certificate

Note:
This overview has an informative and tutorial character and is published for free. All the data, included in the overview, are received from public sources, recognized as more or less reliable. Moreover, there is no guarantee that the indicated information is full and precise. Overviews are not updated. The whole information in each overview, including opinion, indicators, charts and anything else, is provided only for familiarization purposes and is not financial advice or а recommendation. The whole text and its any part, as well as the charts cannot be considered as an offer to make a deal with any asset. IFC Markets and its employees under any circumstances are not liable for any action taken by someone else during or after reading the overview.
