- Analytics
- Technical Analysis
Silver Technical Analysis - Silver Trading: 2019-12-17
US-China deal may cause the correction of precious metals
US and China agreed to sign a phase one trade deal. Will the XAGEUR rise?
An upward movement means an increase in silver prices against the euro. In fact, the signing of a phase one trade deal reduces global risks. US Trade Representative Robert Lighthizer said the deal would double US exports to China over the next 2 years. However, now, the two countries have a 90-day transitional period for the implementation of the mutual agreement. Robert Lighthizer also announced the need for some improvements in the deal. The phase one trade deal between the US and China is expected to be signed in the first week of January 2020. Theoretically, the saying “Buy the Rumor, Sell the Fact” might work, only the opposite way (sell the rumor, buy the fact), as precious metals prices fell in anticipation of the deal. In other words, prior to the signing of the trade agreement, precious metals prices may correct upward in case of any delays and unexpected statements. In anticipation of the US-China deal, the XAGEUR fell about 16% from the high of the current year in September.
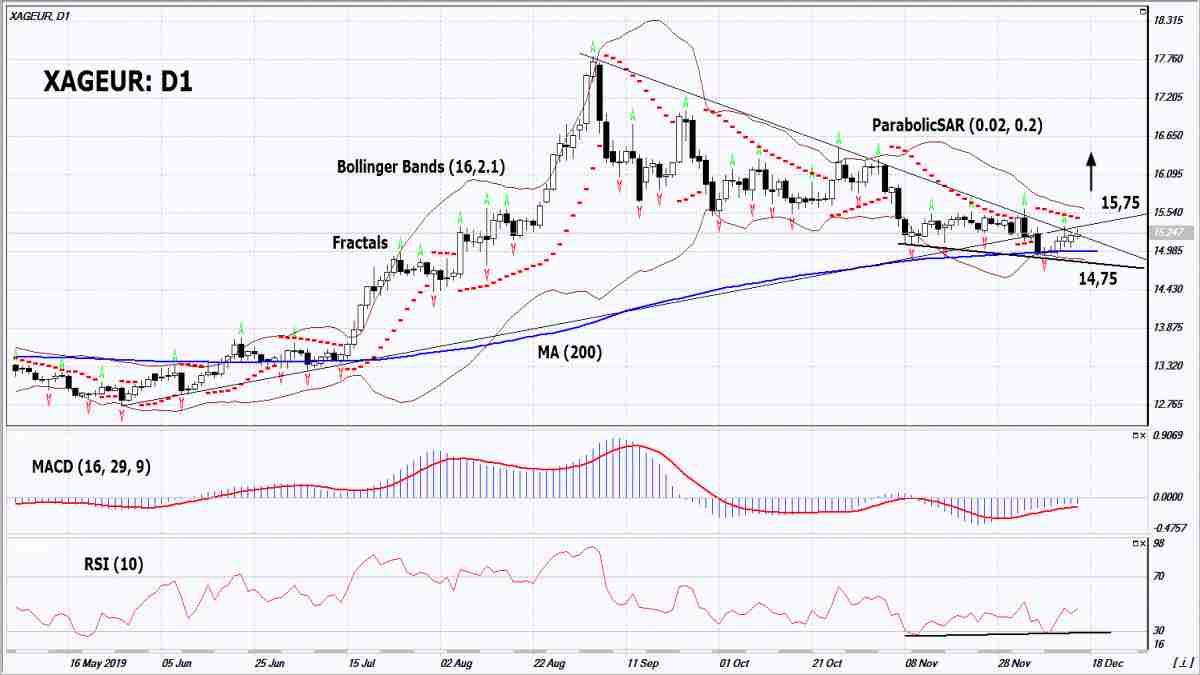
On the daily timeframe, the XAGEUR: D1 trying to move upward from the downtrend. At the same time, its decline slowed down and a number of technical analysis indicators formed buy signals. The further price increase is possible in case of reassessment of global risks upwards.
- The Parabolic indicator gives a bearish signal. It can be used as an additional resistance line, which should be overcome before opening a buy position.
- The Bollinger bands have narrowed, which indicates low volatility.
- The RSI indicator is below 50. It has formed a positive divergence.
- MACD indicator gives a bullish signal.
The bullish momentum may develop in case XAGEUR exceeds the 4 last fractal highs, the Parabolic signal and the upper Bollinger band at 15.65. This level may serve as an entry point. The initial stop loss may be placed below the last fractal low, the 200-day moving average line and the lower Bollinger band at 14.75. After opening the pending order, we shall move the stop to the next fractal low following the Bollinger and Parabolic signals. Thus, we are changing the potential profit/loss to the breakeven point. More risk-averse traders may switch to the 4-hour chart after the trade and place there a stop loss moving it in the direction of the trade. If the price meets the stop level (14.75) without reaching the order (15.65), we recommend closing the position: the market sustains internal changes that were not taken into account.
Summary of technical analysis
| Position | Buy |
| Buy stop | Above 15.65 |
| Stop loss | Below 14.75 |
- Get Certificate

Note:
This overview has an informative and tutorial character and is published for free. All the data, included in the overview, are received from public sources, recognized as more or less reliable. Moreover, there is no guarantee that the indicated information is full and precise. Overviews are not updated. The whole information in each overview, including opinion, indicators, charts and anything else, is provided only for familiarization purposes and is not financial advice or а recommendation. The whole text and its any part, as well as the charts cannot be considered as an offer to make a deal with any asset. IFC Markets and its employees under any circumstances are not liable for any action taken by someone else during or after reading the overview.
