- Analytics
- Technical Analysis
Wheat vs Canadian dollar Technical Analysis - Wheat vs Canadian dollar Trading: 2019-03-13
Winter wheat crop has deteriorated in the US
In this review, we suggest considering the personal composite instrument (PCI) “Wheat vs. the Canadian dollar”. It increases when wheat prices rise on the world market and when the Canadian currency weakens. Is there a possibility for WHEAT/CAD prices to rise?
On Tuesday, wheat prices rose by almost 5% after the publication of the weekly overview by the U.S. Department of Agriculture (USDA). The US Department of Agriculture lowered the estimate of winter wheat crop in Texas with a rating of “good to excellent” to 28% from 36% a week earlier. The estimate of crops with a rating of “poor to very poor”, on the contrary, increased to 30% from 24%. Texas is the 2nd largest producer of winter wheat in the US after Kansas. Let us recall that this year, American farmers planted only 31.3 million acres of winter wheat, which is the minimum since 1909. Low prices were the main reason for this. The main negative factor for the Canadian dollar is the risk of a rate cut by the Bank of Canada. However, currently, the probability of such an event in 2019 is estimated not too high - at the level of 20%. The publication of weak statistics may force the Bank of Canada to soften monetary policy. Its rate is 1.75%, which is higher than 1.4% inflation.
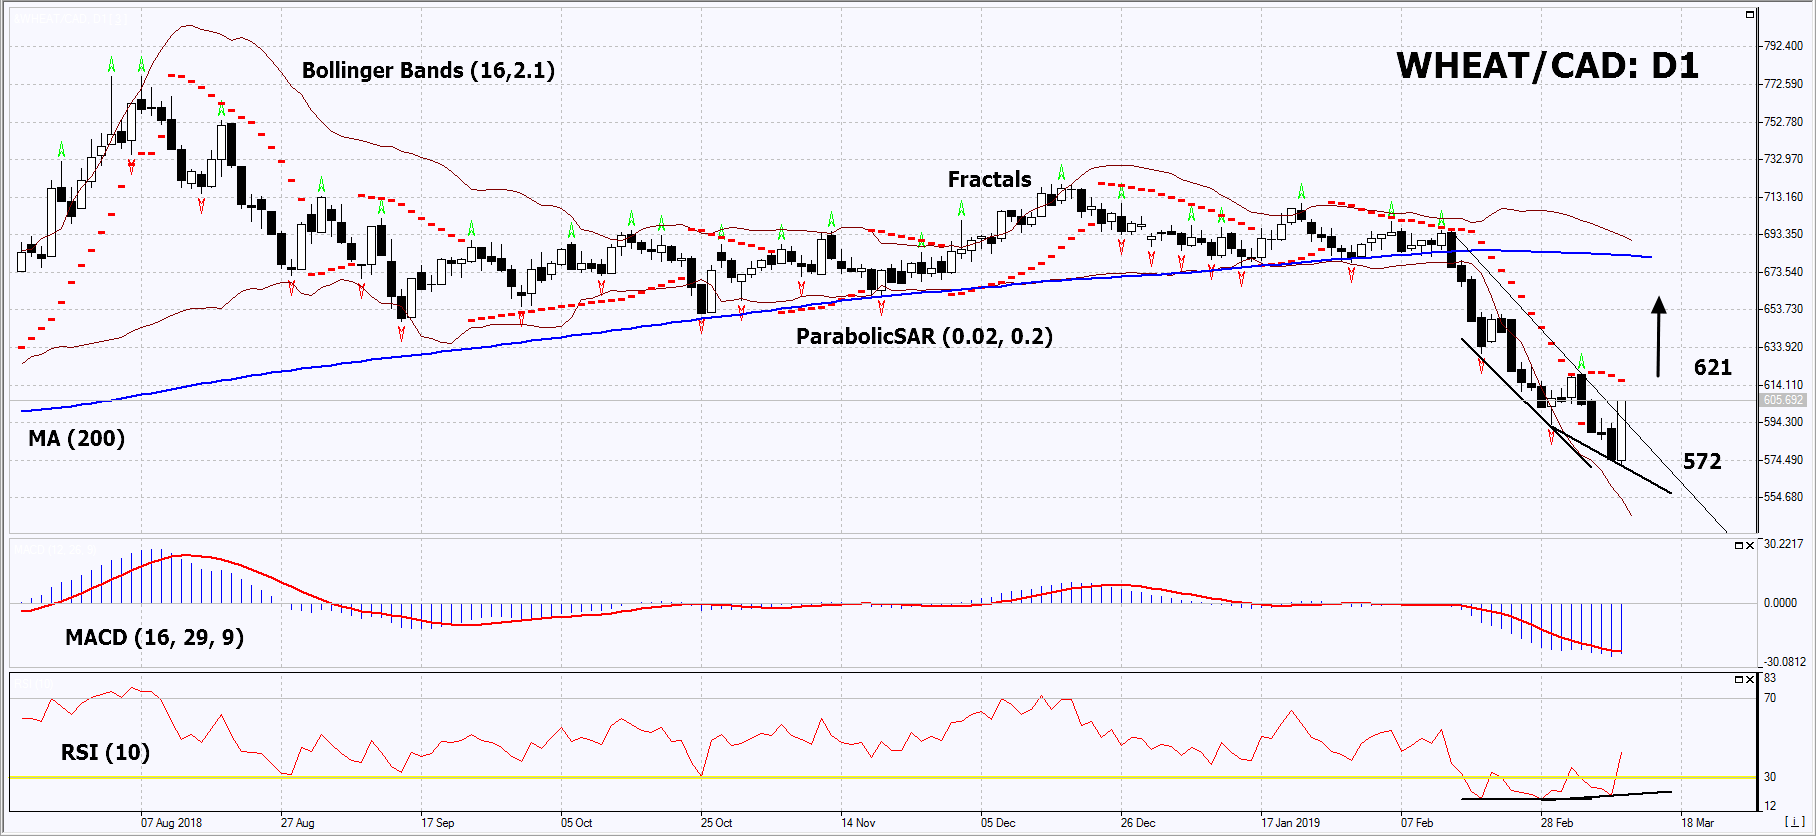
On the daily timeframe, WHEAT/CAD: D1 has breached up the resistance line of the downtrend. A number of technical analysis indicators formed buy signals. The further price increase is possible in case of a shortage of wheat.
- The Parabolic Indicator gives a bearish signal. It can be used as an additional resistance level that should be overcome before opening a buy position.
- The Bollinger bands have widened, which indicates high volatility. Both Bollinger bands are titled down.
- The RSI indicator is below 50. It has formed a positive divergence.
- The MACD indicator gives a bullish signal.
The bullish momentum may develop in case WHEAT/CAD exceeds its last fractal high and the Parabolic signal at 621.This level may serve as an entry point. The initial stop loss may be placed below the last low (since February 2018) at 572. After opening the pending order, we shall move the stop to the next fractal low following the Bollinger and Parabolic signals. Thus, we are changing the potential profit/loss to the breakeven point. More risk-averse traders may switch to the 4-hour chart after the trade and place there a stop loss moving it in the direction of the trade. If the price meets the stop level (572) without reaching the order (621), we recommend to close the position: the market sustains internal changes that were not taken into account.
Summary of technical analysis
| Position | Buy |
| Buy stop | Above 621 |
| Stop loss | Below 572 |
- Get Certificate

Note:
This overview has an informative and tutorial character and is published for free. All the data, included in the overview, are received from public sources, recognized as more or less reliable. Moreover, there is no guarantee that the indicated information is full and precise. Overviews are not updated. The whole information in each overview, including opinion, indicators, charts and anything else, is provided only for familiarization purposes and is not financial advice or а recommendation. The whole text and its any part, as well as the charts cannot be considered as an offer to make a deal with any asset. IFC Markets and its employees under any circumstances are not liable for any action taken by someone else during or after reading the overview.
