- Analytics
- Technical Analysis
US Dollar Index Technical Analysis - US Dollar Index Trading: 2017-10-06
Improving data support USDIDX
Improving US economic data support US dollar. Will the USDIDX continue advancing?
Recent positive data indicate US economic performance is improving. Auto sales jumped in September reversing recent downward trend on the back of strong demand to replace hurricane damaged vehicles. The ISM manufacturing index rose from 58.8 in August to 60.8 in September, the highest reading since 2004. ISM reported Wednesday nonmanufacturing index in September hit a 12-year high of 59.8. Readings above 50 indicate expansion. Today September jobs report is due at 14:30 CET. ADP reported Wednesday that 135000 private sector jobs were created in September. The number was lower than 228000 reading in the previous month, as was widely expected due to a negative impact from hurricanes.
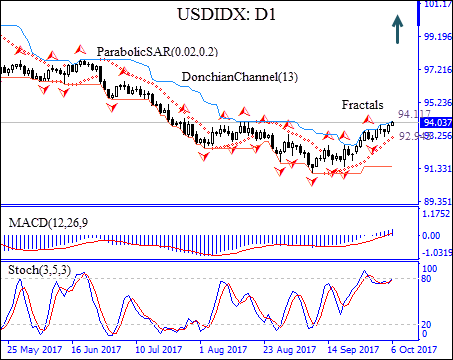
On the daily timeframe the USDIDX: D1 has been rising after hitting 46-month low in the beginning of September.
- The Parabolic indicator gives a buy signal.
- The Donchian channel indicates uptrend: it is tilting upward.
- The MACD indicator gives a bullish signal: it is above the signal line and the gap is widening.
- The Stochastic oscillator is falling but has not reached oversold zone yet.
We expect the bullish momentum will continue after the price breaches above the upper Donchian bound at 94.107. A price above this level can be used as an entry point for a pending order to buy. The stop loss can be placed below the fractal low at 92.943. After placing the pending order, the stop loss is to be moved to the next fractal low, following Parabolic signals. By doing so, we are changing the probable profit/loss ratio to the breakeven point. If the price meets the stop loss level (92.943) without reaching the order, we recommend canceling the position: the market sustains internal changes which were not taken into account.
Technical Analysis Summary
| Position | Buy |
| Buy stop | Above 94.117 |
| Stop loss | Below 92.943 |
- Get Certificate

Note:
This overview has an informative and tutorial character and is published for free. All the data, included in the overview, are received from public sources, recognized as more or less reliable. Moreover, there is no guarantee that the indicated information is full and precise. Overviews are not updated. The whole information in each overview, including opinion, indicators, charts and anything else, is provided only for familiarization purposes and is not financial advice or а recommendation. The whole text and its any part, as well as the charts cannot be considered as an offer to make a deal with any asset. IFC Markets and its employees under any circumstances are not liable for any action taken by someone else during or after reading the overview.
