- Analytics
- Technical Analysis
USD TRY Technical Analysis - USD TRY Trading: 2019-07-23
Getting ready for the meeting of the Central Bank of Turkey
On July 25, 2019, the next meeting of the Central Bank of Turkey will be held, at which the rate may be reduced. Will the Turkish lira rate continue weakening?
On the USDTRY chart, the weakening of the lira looks like a rise. The main rate of the Central Bank of Turkey is considered a week repo. Now its rate is 24%. It has been operating since last September. The rate of the Turkish central bank is significantly higher than inflation, which amounted to 15.72% in June in annual terms. Accordingly, some participants in the foreign exchange market expect a rate cut on Thursday at 11-00 GMT. Moreover, the spread of the rate reduction is very large, from 23.75% to 21.25% already at the end of this meeting. A number of investors believe that the rate will continue to decline at the September and October meetings of the Central Bank of Turkey and eventually drop to 17.5%. Theoretically, this may contribute to the weakening of the Turkish lira.
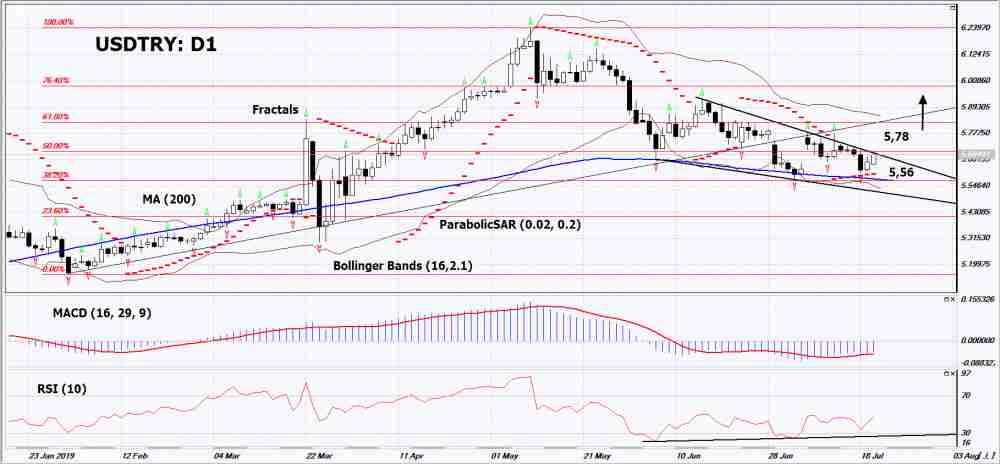
On the daily timeframe USDTRY: D1 is in a downtrend, but the decline slowed down and various technical analysis indicators formed signals to increase. The chart failed three times to break down the 200-day moving average line. Correction to the top and further growth of quotations is possible in case of an aggressive reduction in the rate of the Central Bank of Turkey.
- The Parabolic indicator shows a signal to increase.
- The Bolinger bands narrowed, indicating a volatility decrease.
- The RSI indicator is below 50. It has formed a divergence to increase.
- The MACD indicator gives a bullish signal.
The bullish momentum may develop if USDTRY exceeds the last two upper fractals: 5.78. This level can be used as an entry point. The initial stop lose may be placed below the last two lower fractals, the Parabolic signal and the 200-day moving average line: 5.56. After the opening of a pending order, stop shall be moved following the signals of Bollinger and Parabolic to the next fractal minimum. Thus, we are changing the potential profit/loss to the breakeven point. More risk-averse traders may switch to the 4-hour chart after the trade and place a stop loss moving it in the direction of the trade. If the price meets the stop level (5,56) without reaching the order (5,78), we recommend to cancel the order: the market sustains internal changes that were not taken into account.
Technical Analysis Summary
| Position | Buy |
| Buy stop | Above 5,78 |
| Stop loss | Below 5,56 |
- Get Certificate

Note:
This overview has an informative and tutorial character and is published for free. All the data, included in the overview, are received from public sources, recognized as more or less reliable. Moreover, there is no guarantee that the indicated information is full and precise. Overviews are not updated. The whole information in each overview, including opinion, indicators, charts and anything else, is provided only for familiarization purposes and is not financial advice or а recommendation. The whole text and its any part, as well as the charts cannot be considered as an offer to make a deal with any asset. IFC Markets and its employees under any circumstances are not liable for any action taken by someone else during or after reading the overview.
