- Analytics
- Technical Analysis
USD PLN Technical Analysis - USD PLN Trading: 2019-11-06
Getting ready for a meeting of the Central Bank of Poland
The next meeting of the National Bank of Poland will be held on November 6, 2019. Will the USDPLN quotations continue growing?
The upward movement indicates weakening of the Polish zloty against the US dollar. It is expected that the National Bank of Poland will keep the rate at the current level of 1.5%, at which it has been since 2015. However, theoretically, the National Bank may announce any plans for easing monetary policy in the future. In October, the Polish PMI indicator of business activity in the industry fell to a minimum in 10 years and amounted to 45.6 points. Its decline has been observed for 12 consecutive months. It should be noted that on November 13 the balance of the current account for September will be published in Poland, and on November 14 - the GDP for the 3rd quarter. These data may also affect the dynamics of the zloty.
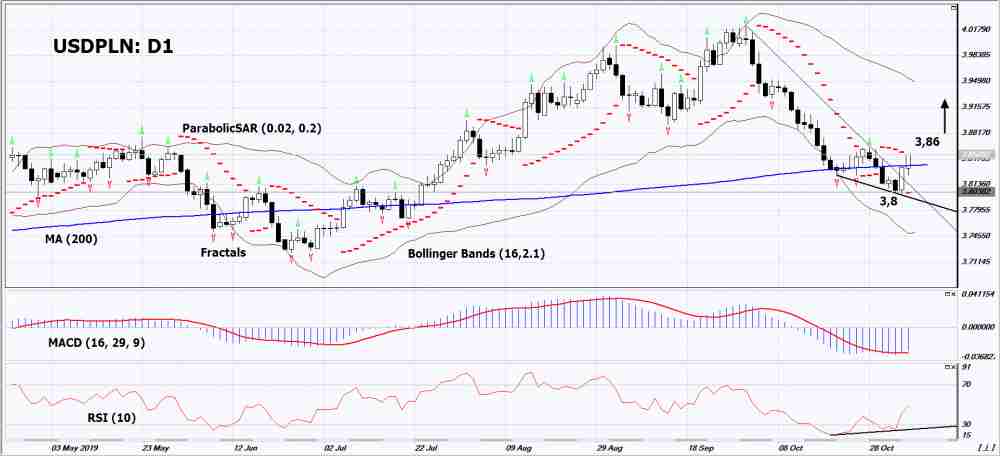
On the daily timeframe USDPLN: D1 broken up the resistance line of the falling trend. Now it is growing as part of the correction. Various technical analysis indicators have generated signals to increase. Further growth of quotations is possible if the monetary policy of the Polish National Bank is relaxed.
- The Parabolic indicator gives an uptrend signal.
- The Bolinger bands widened, indicating high volatility. The bottom line of the Bollinger has a slope up.
- The RSI indicator is below the 50 mark. It has formed a divergence to increase.
- The MACD indicator gives a bullish signal.
The bullish momentum may develop if USDPLN exceeds the last upper fractal: 3.86. This level can be used as an entry point. The initial stop lose may be placed below the Parabolic signal: 3.8. After the opening of the pending order, the stop shall be moved following the Bollinger and Parabolic signals to the next fractal minimum. Thus, we are changing the potential profit/loss to the breakeven point. More risk-averse traders may switch to the 4-hour chart after the trade and place a stop loss moving it in the direction of the trade. If the price meets the stop level (3,8) without reaching the order (3,86), we recommend to cancel the order: the market sustains internal changes that were not taken into account.
Technical Analysis Summary
| Position | Buy |
| Buy stop | Above 3,86 |
| Stop loss | Below 3,8 |
- Get Certificate

Note:
This overview has an informative and tutorial character and is published for free. All the data, included in the overview, are received from public sources, recognized as more or less reliable. Moreover, there is no guarantee that the indicated information is full and precise. Overviews are not updated. The whole information in each overview, including opinion, indicators, charts and anything else, is provided only for familiarization purposes and is not financial advice or а recommendation. The whole text and its any part, as well as the charts cannot be considered as an offer to make a deal with any asset. IFC Markets and its employees under any circumstances are not liable for any action taken by someone else during or after reading the overview.
