- Analytics
- Technical Analysis
S&P 500 Technical Analysis - S&P 500 Trading: 2017-08-15
Corporate report season closes in the US
This week, the corporate earnings season for Q2, 2017 is coming to an end in the US. Is there a possibility for the downward correction of S&P 500?
Currently market participants expect the growth of quarterly, net profit of the companies from the S&P 500 list by 12%, whereas at the beginning of the earnings season the forecasts were much more modest- + 8%. This week, the US companies mainly of the consumer and IT sectors will report: Gap, Wal Mart, Estee Lauder, Ross Stores, Applied Materials, Cisco Systems. If they disappoint investors, this will provoke a correction in the stock market. According to the data of the American Association of Individual Investors, 36.1% of market participants believe that the US stocks will continue to grow and 32.1% expect their decline.
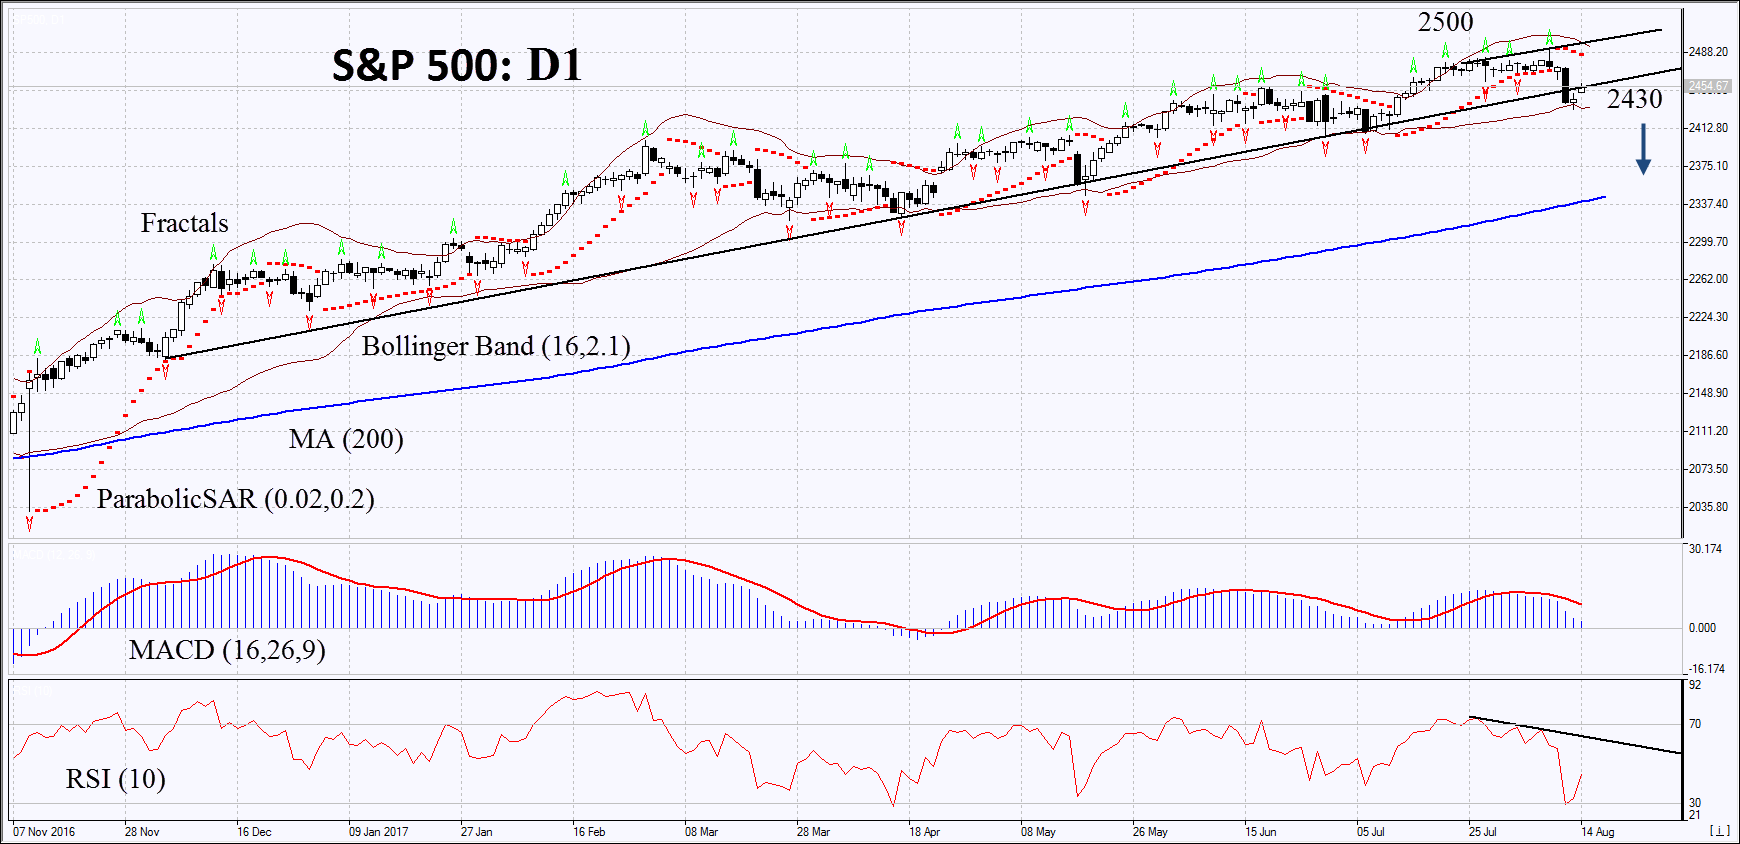
On the daily timeframe, SP500: D1 came down from the rising trend and is currently trying to get back to it. The downward correction is possible in case of the publication of negative economic and corporate information in the US.
- The Parabolic indicator gives a bearish signal.
- The Bollinger bands have narrowed, which means lower volatility. They are tilted downwards.
- The RSI indicator is below 50. It has formed a negative divergence.
- The MACD indicator gives a bearish signal.
The bearish momentum may develop in case SP500 drops below the last low at 2430. This level may serve as an entry point. The initial stop loss may be placed above the last fractal high, the historic high, the upper Bollinger band and the Parabolic signal at 2500. After opening the pending order, we shall move the stop to the next fractal high following the Bollinger and Parabolic signals. Thus, we are changing the potential profit/loss to the breakeven point. More risk-averse traders may switch to the 4-hour chart after the trade and place there a stop loss moving it in the direction of the trade. If the price meets the stop level at 2500 without reaching the order at 2430 we recommend cancelling the position: the market sustains internal changes that were not taken into account.
Summary of technical analysis
| Position | Sell |
| Sell stop | below 2430 |
| Stop loss | above 2500 |
- Get Certificate

Note:
This overview has an informative and tutorial character and is published for free. All the data, included in the overview, are received from public sources, recognized as more or less reliable. Moreover, there is no guarantee that the indicated information is full and precise. Overviews are not updated. The whole information in each overview, including opinion, indicators, charts and anything else, is provided only for familiarization purposes and is not financial advice or а recommendation. The whole text and its any part, as well as the charts cannot be considered as an offer to make a deal with any asset. IFC Markets and its employees under any circumstances are not liable for any action taken by someone else during or after reading the overview.
