- Analytics
- Technical Analysis
Soybean Trade Technical Analysis - Soybean Trade Trading: 2019-10-30
Demand for US soybeans in China may be less than expected
Demand for US soybeans in China may not be as large as previously expected. Will the Soyb quotations continue falling?
The U.S. Agriculture Department (USDA) previously reported exporting 475,000 tons of soybeans to China over the past week. This is noticeably less than the expected 800 thousand - 1.6 million tons. Last year, China introduced retaliatory duties on American soybeans, which should be abolished during the current trade negotiations between the two countries. It was assumed that after this, China will purchase up to 10 million tons of American soybeans per year. Theoretically, this demand has already been taken into account in current quotes. Meanwhile, before the sanctions (in 2017), China purchased only 8.4 million tons in the United States. In the current market year, which started in September, the USDA has so far confirmed shipments of 6 million tons of soybeans to China. The risk that China will acquire less American soy than expected could have a negative effect on quotations. Currently, the US is harvesting soybeans. Weather conditions are quite favorable and it may exceed forecasts.
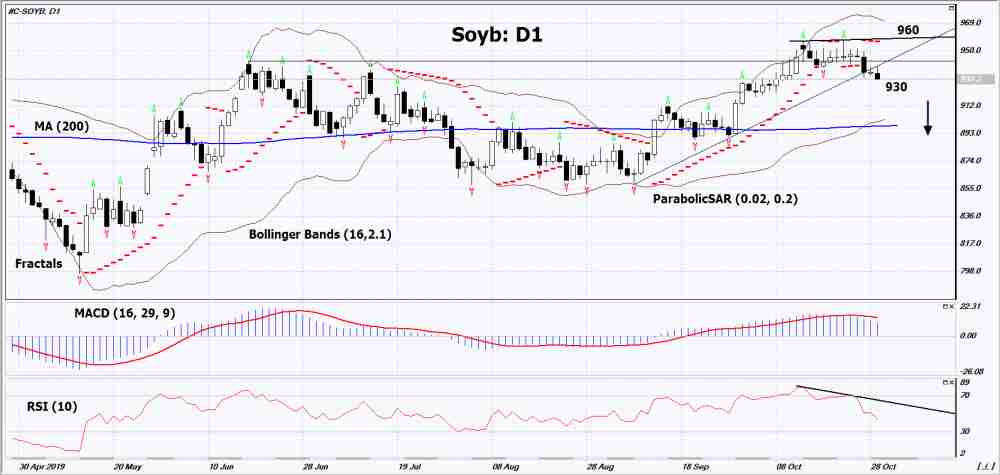
On the daily timeframe Soyb: D1 broke down the support line of a growing trend. Most technical analysis indicators formed a signal to decline. A downward movement may occur in the case of a large crop in the United States and a decrease in demand in China.
- The Parabolic indicator gives a bullish signal.
- The Bolinger bands widened, indicating high volatility. The upper Bollinger line has a downward slope.
- The RSI indicator is below the mark of 50. It has formed a divergence to fall.
- The MACD indicator demonstrates a downward signal.
The bullish momentum may develop if Soyb falls below the last low: 930. This level can be used as an entry point. The initial stop lose may be placed higher than the last upper fractal, the maximum since June 2018 and the Parabolic signal: 960. After opening a pending order, the stop shall be moved following the Bollinger and Parabolic signals to the next fractal minimum. Thus, we are changing the potential profit/loss to the breakeven point. More risk-averse traders may switch to the 4-hour chart after the trade and place a stop loss moving it in the direction of the trade. If the price meets the stop level (960) without reaching the order (930), we recommend to cancel the order: the market sustains internal changes that were not taken into account.
Technical Analysis Summary
| Position | Sell |
| Sell stop | Below 930 |
| Stop loss | Above 960 |
- Get Certificate

Note:
This overview has an informative and tutorial character and is published for free. All the data, included in the overview, are received from public sources, recognized as more or less reliable. Moreover, there is no guarantee that the indicated information is full and precise. Overviews are not updated. The whole information in each overview, including opinion, indicators, charts and anything else, is provided only for familiarization purposes and is not financial advice or а recommendation. The whole text and its any part, as well as the charts cannot be considered as an offer to make a deal with any asset. IFC Markets and its employees under any circumstances are not liable for any action taken by someone else during or after reading the overview.
