- Analytics
- Technical Analysis
WTI Crude Technical Analysis - WTI Crude Trading: 2018-03-14
Shale oil production is expected to grow in the US
The U.S. Energy Information Administration (EIA) reported a possible increase in shale oil production in the United States. Will WTI quotes drop??
In March 2018, the US shale oil production was 6.82 mln. According to the EIA forecast, it will increase by 130 thousand barrels per day reaching 6.95 mln barrels per day in April. At the same time, the total production of all types of oil in the United States will exceed 10 mln barrels per day. Market participants react to such reports, as the EIA expects an aggregate increase in the US oil production to 11 mln barrels per day by the end of this year. This additional for the market 1 mln barrels per day may move WTI quotes down. Their dynamics may be affected by the next data on the US oil reserves, which will be released on Wednesday, March 14. According to preliminary forecasts, the reserves may increase for the third consecutive week, which is a negative factor for the quotes.
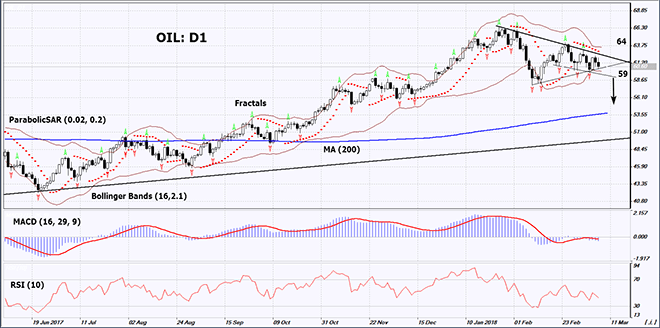
On the daily timeframe, OIL: D1 is in the triangle. The further price increase is possible in case of the increase in the reserves and the oil production in the US.
- The Parabolic indicator gives a bearish signal.
- The Bollinger bands have narrowed, which means lower volatility.
- The RSI indicator is below 50. It has formed a negative divergence.
- The MACD indicator gives a bearish signal.
The bearish momentum may develop in case OIL drops below its last fractal low and the lower Bollinger band at 59. This level may serve as an entry point. The initial stop loss may be placed above the two last fractal highs, the upper Bollinger band and the Parabolic signal at 64. After opening the pending order, we shall move the stop to the next fractal high following the Bollinger and Parabolic signals. Thus, we are changing the potential profit/loss to the breakeven point. More risk-averse traders may switch to the 4-hour chart after the trade and place there a stop loss moving it in the direction of the trade. If the price meets the stop level at 59 without reaching the order at 64, we recommend cancelling the position: the market sustains internal changes that were not taken into account.
Summary of technical analysis
| Position | Sell |
| Sell stop | below 59 |
| Stop loss | above 64 |
- Get Certificate

Note:
This overview has an informative and tutorial character and is published for free. All the data, included in the overview, are received from public sources, recognized as more or less reliable. Moreover, there is no guarantee that the indicated information is full and precise. Overviews are not updated. The whole information in each overview, including opinion, indicators, charts and anything else, is provided only for familiarization purposes and is not financial advice or а recommendation. The whole text and its any part, as well as the charts cannot be considered as an offer to make a deal with any asset. IFC Markets and its employees under any circumstances are not liable for any action taken by someone else during or after reading the overview.
