- Analytics
- Technical Analysis
OATS Technical Analysis - OATS Trading: 2019-03-26
Weather deterioration in the US may reduce cereal yields
There is severe flooding in the Midwestern United States, which can damage cereal crops. Will oat prices rise?
Because of the severe flooding on the Missouri River, crops in Montana, North Dakota and Nebraska may be damaged. However, it should be noted that the European Union, Russia and Canada are the world leaders in oat production. The United States is the largest importer of this type of grain, while China and Mexico are in the second and third places.
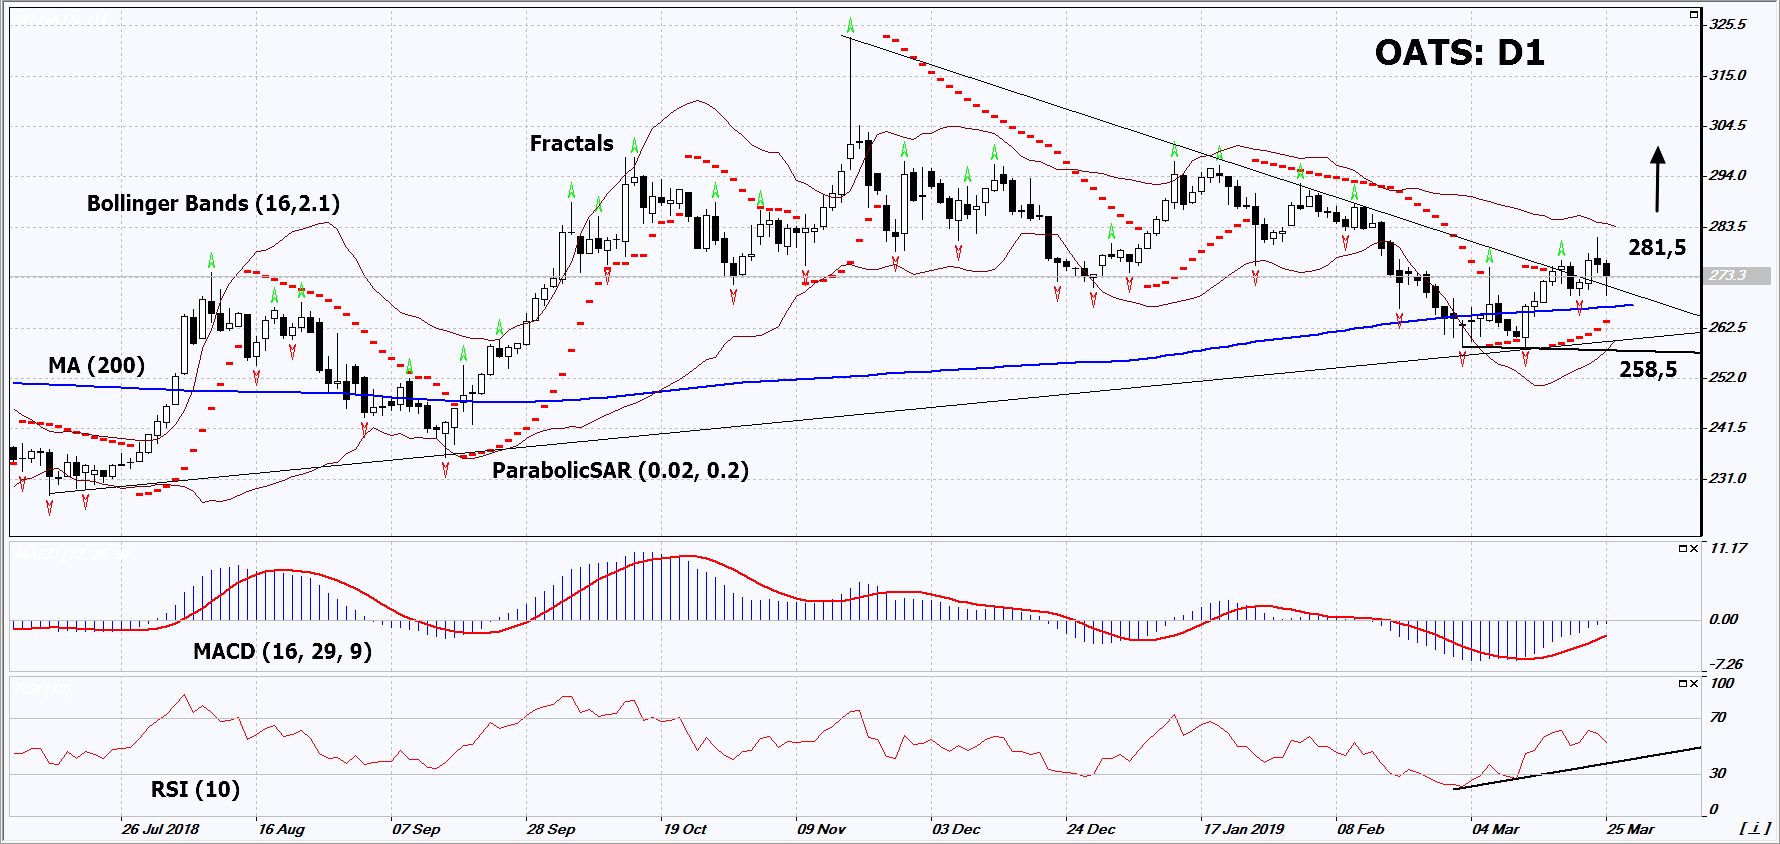
On the daily timeframe, OATS: D1 breached up the resistance line of the falling channel and the 200-day moving average line. A number of technical analysis indicators formed buy signals. The further price increase is possible in case of a reduction in world harvest.
- The Parabolic Indicator gives a bullish signal.
- The Bollinger bands have narrowed, which indicates low volatility. The upper Bollinger band is titled upward.
- The RSI indicator is above 50. It has formed a positive divergence.
- The MACD indicator gives a bullish signal.
The bullish momentum may develop in case OATS exceed their last high at 281.5. This level may serve as an entry point. The initial stop loss may be placed below the two last fractal lows, the lower Bollinger band, the 200-day moving average line and the Parabolic signal at 258.5. After opening the pending order, we shall move the stop to the next fractal low following the Bollinger and Parabolic signals. Thus, we are changing the potential profit/loss to the breakeven point. More risk-averse traders may switch to the 4-hour chart after the trade and place there a stop loss moving it in the direction of the trade. If the price meets the stop level (258.5) without reaching the order (281.5), we recommend to close the position: the market sustains internal changes that were not taken into account.
Summary of technical analysis
| Position | Buy |
| Buy stop | Above 281.5 |
| Stop loss | Below 258.5 |
- Get Certificate

Note:
This overview has an informative and tutorial character and is published for free. All the data, included in the overview, are received from public sources, recognized as more or less reliable. Moreover, there is no guarantee that the indicated information is full and precise. Overviews are not updated. The whole information in each overview, including opinion, indicators, charts and anything else, is provided only for familiarization purposes and is not financial advice or а recommendation. The whole text and its any part, as well as the charts cannot be considered as an offer to make a deal with any asset. IFC Markets and its employees under any circumstances are not liable for any action taken by someone else during or after reading the overview.
