- Analytics
- Technical Analysis
Nikkei Index Technical Analysis - Nikkei Index Trading: 2018-11-16
Slowing private spending and exports bearish for NIKKEI
Japanese economy shrank more than expected in third quarter. Will the NIKKEI continue declining?
The Cabinet Office of the government of Japan reported on Wednesday Japan’s economy shrank in the third quarter: the annualized 1.2% quarter-on-quarter gross domestic product decline in the three months to September 2018 was worse than a 1% contraction forecast, and followed a 3% expansion in the second quarter. The contraction was the result of a decline in private consumption, public demand and exports. Earlier data showed industrial production fell in September when a growth was expected, the same as household spending. Weak economic data are bearish for NIKKEI.
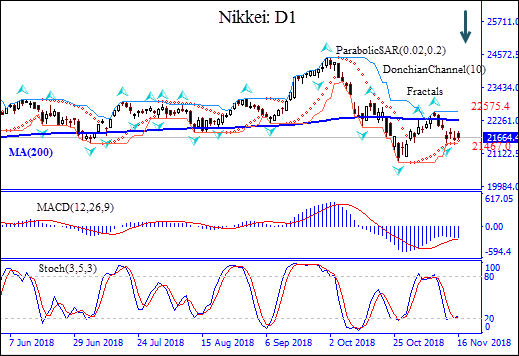
On the daily timeframe the NIKKEI: D1 has returned below the 200-day moving average MA(200) which has leveled off
- The Parabolic indicator gives a buy signal.
- The Donchian channel indicates no trend yet: it is flat.
- The MACD indicator gives a bearish signal: it is below the signal line and the gap is widening.
- The Stochastic oscillator is rising but has not reached the overbought zone.
We believe the bearish momentum will continue after the price breaches below the lower boundary of Donchian channel at 21467.00. This level can be used as an entry point for placing a pending order to sell. The stop loss can be placed above the upper Donchian channel at 22575.40. After placing the order, the stop loss is to be moved every day to the next fractal high, following Parabolic signals. Thus, we are changing the expected profit/loss ratio to the breakeven point. If the price meets the stop loss level (22575.40) without reaching the order (21467.00), we recommend cancelling the order: the market has undergone internal changes which were not taken into account.
Technical Analysis Summary
| Position | Sell |
| Sell stop | Below 21467.00 |
| Stop loss | Above 22575.40 |
- Get Certificate

Note:
This overview has an informative and tutorial character and is published for free. All the data, included in the overview, are received from public sources, recognized as more or less reliable. Moreover, there is no guarantee that the indicated information is full and precise. Overviews are not updated. The whole information in each overview, including opinion, indicators, charts and anything else, is provided only for familiarization purposes and is not financial advice or а recommendation. The whole text and its any part, as well as the charts cannot be considered as an offer to make a deal with any asset. IFC Markets and its employees under any circumstances are not liable for any action taken by someone else during or after reading the overview.
