- Analytics
- Technical Analysis
GBP USD Technical Analysis - GBP USD Trading: 2015-11-03
Awaiting important economic indicators
In Great Britain strong macroeconomic indicators were released. As a result, the GBPUSD exchange rate hit a 10-week high. Will its growth continue?
The October PMI by Markit reached its 16-month high exceeding forecasts and amounting to 55.5. Now several investors assume the GDP growth in the 4th quarter can reach 1% increasing twofold since the 3rd quarter where the quarterly growth was 0.5%. This makes the British pound stronger. The upcoming week will be rich in the events that can influence the pound. On November 4 the more precise estimate of the economic expansion in this quarter is likely to be given after the composite and services PMI will come out. The tentative outlook for them is positive. On November 5 the Bank of England meeting is due, it will also release the inflation report. On November 6 the UK trade balance and industrial production for September will be released. In our opinion, the tentative outlook is neutral.
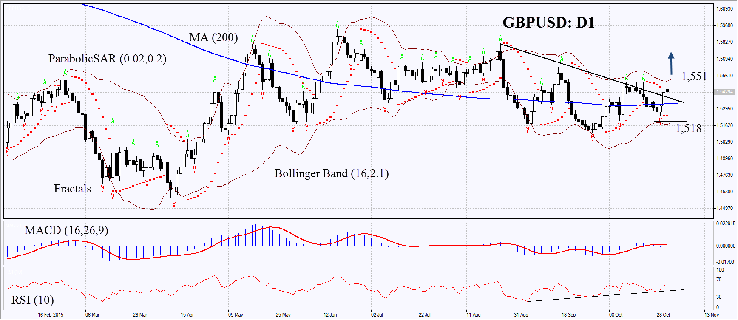
On the daily chart the PCI instrument GBPUSD: D1 has switched from the downtrend to the neutral trend and is above its 200-day moving average line. The Parabolic indicator gives buy signal. RSI is on the rise. It has not reached the overbought zone yet but is above 50. Divergence is not seen. The MACD histogram bars are too small to form the signal. The Bollinger bands have contracted, which may mean lower volatility, and are tilted upwards. The bullish momentum may develop in case the pound surpasses two last fractal highs at 1551. The level can serve the point of entry. The initial risk-limits may be placed below the Bollinger line and the second fractal low at 1.518. Having opened the pending order we shall move the stop to the next fractal low following the Parabolic signal every 4 hours. Thus, we are changing the probable profit/loss ratio to the breakeven point. The most risk-averse traders may switch to the 4-hour chart after the trade and place there a stop-loss moving it in the direction of the trade. If the price meets the stop-loss level of 1.518 without reaching the order of 1.551, we recommend cancelling the position: the market sustains internal changes which were not taken into account.
| Position | Buy |
| Buy stop | above 1,551 |
| Stop loss | below 1,518 |
- Get Certificate

Note:
This overview has an informative and tutorial character and is published for free. All the data, included in the overview, are received from public sources, recognized as more or less reliable. Moreover, there is no guarantee that the indicated information is full and precise. Overviews are not updated. The whole information in each overview, including opinion, indicators, charts and anything else, is provided only for familiarization purposes and is not financial advice or а recommendation. The whole text and its any part, as well as the charts cannot be considered as an offer to make a deal with any asset. IFC Markets and its employees under any circumstances are not liable for any action taken by someone else during or after reading the overview.
