- Analytics
- Technical Analysis
GB 100 Index Technical Analysis - GB 100 Index Trading: 2018-03-23
Lower public spending and stronger Pound bearish for GB100
Public spending and construction activity slowed in January. Will the GB 100 index continue declining?
UK economic data were mostly weak lately. The trade deficit widened, manufacturing production growth slowed and construction output fell in January. At the same time consumer confidence index declined in February, according to the Gfk report. The ONS said Wednesday that public sector borrowing in the UK in the 11 months through February was 6% lower than the same period a year earlier. Treasury chief Philip Hammond said he intends to keep a tight rein on spending in the coming years to bring down public debt. And it is widely believed the Bank of England will hike rates at its May meeting. Lower public spending and stronger Pound are bearish for UK economic growth. However rising retail sales, as indicated by increase in February reading, is bullish risk for GB100.
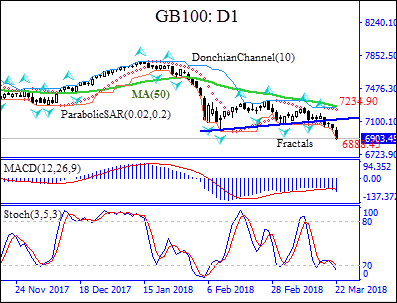
On the daily chart GB100: D1 is declining after hitting all-time high in mid-January. It is below the 50-day moving average MA(50) which is falling too.
- The Parabolic indicator has formed a sell signal.
- The Donchian channel indicates downtrend: it is tilted lower.
- The MACD indicator is below the signal line with the gap widening. This is a bearish signal.
- The stochastic oscillator is in the oversold zone, this is a bullish signal.
We believe a bearish momentum will continue after the price breaches below the lower Donchian boundary at 6888.46. This level can be used as an entry point for placing a pending order to sell. The stop loss can be placed above the upper Donchian channel at 7234.90. After placing the pending order the stop loss is to be moved every day to the next fractal high, following Parabolic signals. Thus, we are changing the probable profit/loss ratio to the breakeven point. If the price meets the stop-loss level (7234.90) without reaching the order (6888) we recommend cancelling the order: the market sustains internal changes which were not taken into account.
Technical Analysis Summary
| Position | Sell |
| Sell Stop | Below 6888 |
| Stop loss | Above 7234.90 |
- Get Certificate

Note:
This overview has an informative and tutorial character and is published for free. All the data, included in the overview, are received from public sources, recognized as more or less reliable. Moreover, there is no guarantee that the indicated information is full and precise. Overviews are not updated. The whole information in each overview, including opinion, indicators, charts and anything else, is provided only for familiarization purposes and is not financial advice or а recommendation. The whole text and its any part, as well as the charts cannot be considered as an offer to make a deal with any asset. IFC Markets and its employees under any circumstances are not liable for any action taken by someone else during or after reading the overview.
