- Analytics
- Technical Analysis
EUR USD Technical Analysis - EUR USD Trading: 2017-06-19
In the current and next years, the Fed is going to raise rates 4 more times
At the previous meeting on June 15, 2017, the US Federal Reserve raised the base interest rate by 25 basis points to 1-1.25%. This contributed to the strengthening of the US dollar. Will the EURUSD fall?
The Fed confirmed its intention to raise the rate one more time this year and three times in 2018. In addition, the American regulator announced plans to reduce the portfolio of government bonds on its balance sheet in the amount of $4.5 trillion. It involves reducing by $6 billion monthly the reinvestment of maturing treasury bonds, and by $4 billion- mortgage securities. These amounts will rise each quarter until they reach $30 billion and $20 billion per month, respectively. Market participants very positively assessed such reduction in the Fed's balance sheet. Note that the ECB, on the contrary, is not going to tighten its monetary policy, refuse to issue euro and raise the rate.
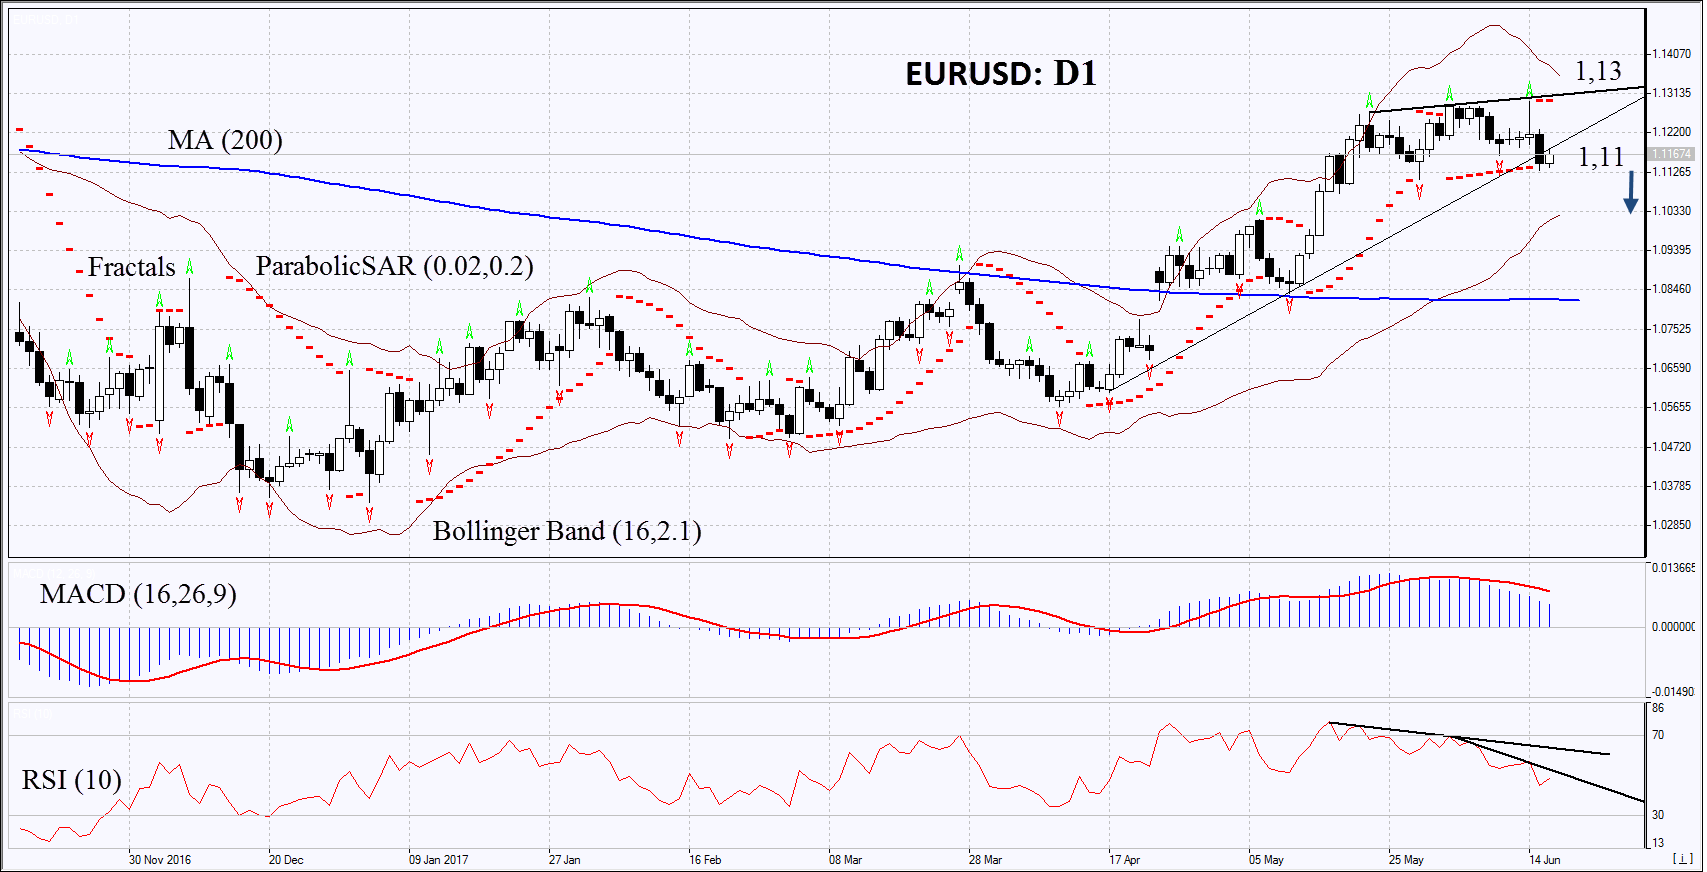
On the daily timeframe, EURUSD: D1 left the rising trend. A downward correction is possible in case of the worsening of economic indicators in the Eurozone and improvement of economic indicators in the USA.
- The Parabolic indicator gives a bearish signal.
- The Bollinger bands have narrowed, which indicates low volatility.
- The RSI indicator is below 50. It has formed double negative divergence.
- The MACD indicator gives a bearish signal.
The bearish momentum may develop in case EURUSD falls below the last fractal low at 1.11. This level may serve as an entry point. The initial stop-loss may be placed above the last fractal high, the 7-month maximum and the Parabolic signal at 1.13. After placing the pending order, we shall move the stop to the next fractal high following the Bollinger and Parabolic signals. Thus, we are changing the potential profit/loss to the breakeven point. More risk-averse traders may switch to the 4-hour chart after the trade and place there a stop-loss moving it in the direction of the trade. If the price meets the stop level 1.13 without reaching the order at 1.11, we recommend cancelling the position: the market sustains internal changes that were not taken into account.
Summary of technical analysis
| Position | Sell |
| Sell stop | Below 1,11 |
| Stop loss | Above 1,13 |
- Get Certificate

Note:
This overview has an informative and tutorial character and is published for free. All the data, included in the overview, are received from public sources, recognized as more or less reliable. Moreover, there is no guarantee that the indicated information is full and precise. Overviews are not updated. The whole information in each overview, including opinion, indicators, charts and anything else, is provided only for familiarization purposes and is not financial advice or а recommendation. The whole text and its any part, as well as the charts cannot be considered as an offer to make a deal with any asset. IFC Markets and its employees under any circumstances are not liable for any action taken by someone else during or after reading the overview.
