- Analytics
- Technical Analysis
EUR CHF Technical Analysis - EUR CHF Trading: 2017-12-13
Preparing for the Central Banks’ Meetings
On December 14, 2017, the meetings of the European Central Bank and the Swiss National Bank will be held. No changes in rates are expected. Will the EURCHF quotes decrease?
A downward movement occurs in case of the weakening of the euro and strengthening of the Swiss franc. Previously, EURCHF updated the 2-year high. A downward correction is possible on the background of an increase in the Swiss economy by 1.2% in the Q3 of 2017. No changes in the Swiss National Bank (SNB) rate are expected, but in the future, it can make some statements about the tightening of the monetary policy. The SNB rate is negative and amounts to 0.75%. At the same time, in annual terms, the inflation in November of this year was positive: it updated the high since March 2011 and reached + 0.8%.
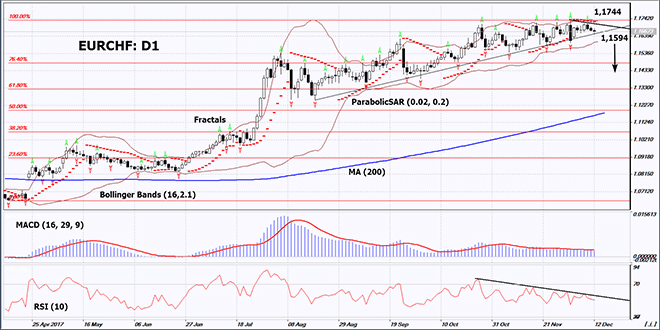
On the daily timeframe, EURCHF: D1 remains in the rising trend. Its price growth has slowed down and some technical analysis indicators have formed bearish signals. A downward correction is possible in case of the publication of negative economic and corporate information in the Eurozone and positive information in Switzerland.
- The Parabolic indicator gives a bearish signal.
- The Bollinger bands have narrowed, which means lower volatility. They are tilted down.
- The RSI indicator is below 50. It has formed a negative divergence.
- The MACD indicator gives a bearish signal.
The bearish momentum may develop in case EURCHF drops below the last fractal low and the lower Bollinger band at 1.1594. This level may serve as an entry point. The initial stop loss may be placed above the two last fractal highs, the 2-year high, the upper Bollinger band and the Parabolic signal at 1.1744. After opening the pending order, we shall move the stop to the next fractal high following the Bollinger and Parabolic signals. Thus, we are changing the potential profit/loss to the breakeven point. More risk-averse traders may switch to the 4-hour chart after the trade and place there a stop loss moving it in the direction of the trade. If the price meets the stop level at 1.1594 without reaching the order at 1.1744, we recommend cancelling the position: the market sustains internal changes that were not taken into account.
Summary of technical analysis
| Position | Sell |
| Sell stop | below 1,1594 |
| Stop loss | above 1,1744 |
- Get Certificate

Note:
This overview has an informative and tutorial character and is published for free. All the data, included in the overview, are received from public sources, recognized as more or less reliable. Moreover, there is no guarantee that the indicated information is full and precise. Overviews are not updated. The whole information in each overview, including opinion, indicators, charts and anything else, is provided only for familiarization purposes and is not financial advice or а recommendation. The whole text and its any part, as well as the charts cannot be considered as an offer to make a deal with any asset. IFC Markets and its employees under any circumstances are not liable for any action taken by someone else during or after reading the overview.
