- Analytics
- Technical Analysis
DE 30 Technical Analysis - DE 30 Trading: 2018-11-15
Slower German growth bearish for DE30
German economic growth slowed more than expected in the third quarter. Will the DE30 continue declining?
German economic data were negative on balance lately: economic growth slowed more than expected in the third quarter. Germany's Q3 gross domestic product slowed to 1.1% over year when 1.3% growth was expected after 2% growth in the second quarter . The decline was due to exports drop while imports rose from the second quarter, according to Germany's statistics agency Destatis. And a week ago a group of 5 economic advisors to the German government cut their growth forecasts for this year and next: to 1.6% this year compared with 2.3% projected previously, and 1.5% in 2019. Slowing growth is bearish for DE30.
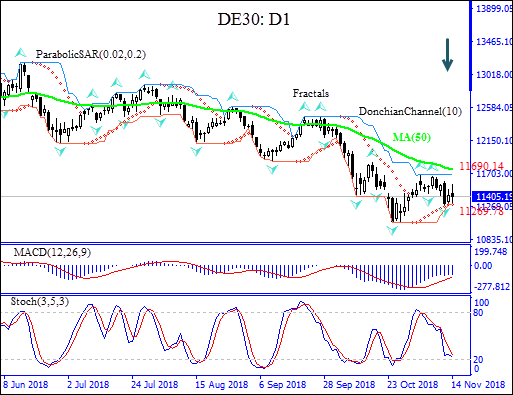
On the daily timeframe the DE30: D1 is below the 200-day moving average MA(200) which is falling, this is bearish.
- The Parabolic indicator gives a buy signal.
- The Donchian channel indicates no trend yet: it is flat.
- The MACD indicator gives a neutral signal: it is below the signal line and the gap is steady.
- The Stochastic oscillator is falling but has not breached into oversold zone yet.
We believe the bearish momentum will continue after the price breaches below the lower boundary of Donchian channel at 11269.78. This level can be used as an entry point for placing a pending order to sell. The stop loss can be placed above the upper Donchian channel at 11690.14. After placing the order, the stop loss is to be moved every day to the next fractal high, following Parabolic signals. Thus, we are changing the probable profit/loss ratio to the breakeven point. If the price meets the stop loss level (11690.14) without reaching the order (11269.78), we recommend cancelling the order: the market has undergone internal changes which were not taken into account.
Technical Analysis Summary
| Position | Sell |
| Sell stop | Below 11269.78 |
| Stop loss | Above 11690.14 |
- Get Certificate

Note:
This overview has an informative and tutorial character and is published for free. All the data, included in the overview, are received from public sources, recognized as more or less reliable. Moreover, there is no guarantee that the indicated information is full and precise. Overviews are not updated. The whole information in each overview, including opinion, indicators, charts and anything else, is provided only for familiarization purposes and is not financial advice or а recommendation. The whole text and its any part, as well as the charts cannot be considered as an offer to make a deal with any asset. IFC Markets and its employees under any circumstances are not liable for any action taken by someone else during or after reading the overview.
