- Analytics
- Technical Analysis
COPPER Technical Analysis - COPPER Trading: 2019-12-09
Lower US recession risks
Good labor market data came out in the US. This reduced the risks of a slowdown in the global economy. Will Copper prices continue rising?
Nonfarm payrolls in the United States increased by 266 thousand in November, which is a 10-month high. This can significantly reduce recession risks in the US and global economies. In addition, China announced the abolition of certain duties on US goods, which could be a signal of its readiness to continue trade negotiations with the United States.
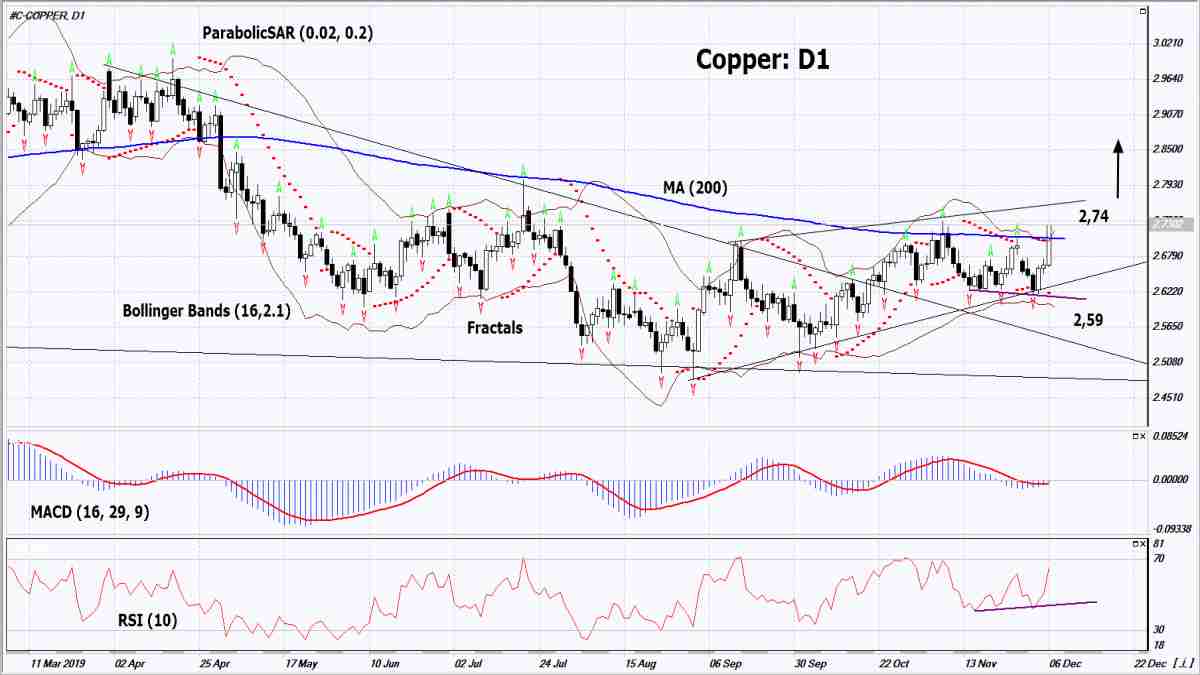
On the daily timeframe the Copper: D1 is in an uptrend and has already bounced off from its lower boundary for the 3rd time. A number of technical analysis indicators formed buy signals. The chart breached up the 200-day moving average line. The further price growth is possible in case of an increase in demand for copper in China and the US.
- The Parabolic indicator gives a bullish signal.
- The Bollinger bands have narrowed, which indicates low volatility. The upper Bollinger band is titled upward
- The RSI indicator is above 50. It has formed a positive divergence.
- The MACD indicator gives a bullish signal.
The bullish momentum may develop in case Copper exceeds the three last fractal highs at 2.74. This level may serve as an entry point. The initial stop loss may be placed below the lower Bollinger band at 2.59. After opening the pending order, we shall move the stop to the next fractal low following the Bollinger and Parabolic signals. Thus, we are changing the potential profit/loss to the breakeven point. More risk-averse traders may switch to the 4-hour chart after the trade and place there a stop loss moving it in the direction of the trade. If the price meets the stop level (2.59) without reaching the order (2.74), we recommend closing the position: the market sustains internal changes that were not taken into account.
Summary of technical analysis
| Position | Buy |
| Buy stop | Above 2.74 |
| Stop loss | Below 2.59 |
- Get Certificate

Note:
This overview has an informative and tutorial character and is published for free. All the data, included in the overview, are received from public sources, recognized as more or less reliable. Moreover, there is no guarantee that the indicated information is full and precise. Overviews are not updated. The whole information in each overview, including opinion, indicators, charts and anything else, is provided only for familiarization purposes and is not financial advice or а recommendation. The whole text and its any part, as well as the charts cannot be considered as an offer to make a deal with any asset. IFC Markets and its employees under any circumstances are not liable for any action taken by someone else during or after reading the overview.
