- Analytics
- Technical Analysis
CHF JPY Technical Analysis - CHF JPY Trading: 2017-12-04
Preparing for the publication of important economic data
The Japanese yen is declining on the background of the regular tests of North Korean missiles. The Swiss franc is strengthening due to positive economic indicators. Will the CHF/JPY quotes increase?
On November 30, 2017 positive data came out on Switzerland GDP growth by 1.2% in annual terms for Q3. At the same time, the outpacing KOF Economic Barometer rose to 110.3 points in November, which is the highest since mid-2010. It shows that the Swiss economic growth may continue. Recall that on December 6, 2017 the inflation data will come out in Switzerland, and on December 14, the next meeting of the Swiss National Bank will take place. These may affect the exchange rate. Besides the political risks because of the situation in the DPRK, the yen is weakening against the US dollar amid the plans to approve Donald Trump’s tax reform and positive US economic information. On December 8, 2017 the GDP data for Q3 will come out in Japan. They may affect the exchange rate.
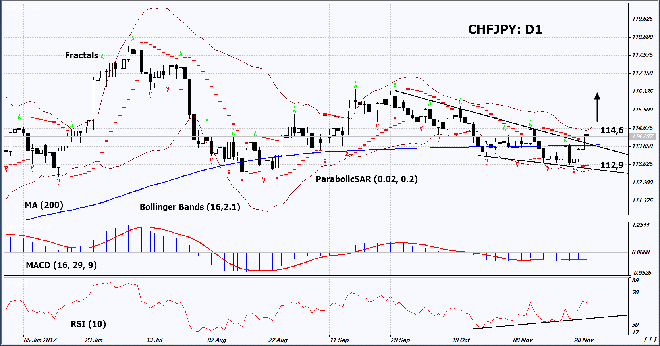
On the daily timeframe, CHF/JPY: D1 exceeded the resistance line of the downtrend and the 200-day moving average line. Further price increase is possible in case of the publication of positive economic data in Switzerland and negative data in Japan.
- The Parabolic indicator gives a bullish signal.
- The Bollinger bands are narrowing, which means lower volatility. They are tilted upwards.
- The RSI indicator is above 50. It has formed a positive divergence.
- The MACD indicator gives a bullish signal.
The bullish momentum may develop in case CHF/JPY exceeds the two last fractal highs, the upper Bollinger band at 114.6. This level may serve as an entry point. The initial stop loss may be placed below the last fractal low and the Parabolic signal at 112.9. After opening the pending order, we shall move the stop to the next fractal low following the Bollinger and Parabolic signals. Thus, we are changing the potential profit/loss to the breakeven point. More risk-averse traders may switch to the 4-hour chart after the trade and place there a stop loss moving it in the direction of the trade. If the price meets the stop level at 112.9 without reaching the order at 114.6, we recommend cancelling the position: the market sustains internal changes that were not taken into account.
Summary of technical analysis
| Position | Buy |
| Buy stop | above 114,6 |
| Stop loss | below 112,9 |
- Get Certificate

Note:
This overview has an informative and tutorial character and is published for free. All the data, included in the overview, are received from public sources, recognized as more or less reliable. Moreover, there is no guarantee that the indicated information is full and precise. Overviews are not updated. The whole information in each overview, including opinion, indicators, charts and anything else, is provided only for familiarization purposes and is not financial advice or а recommendation. The whole text and its any part, as well as the charts cannot be considered as an offer to make a deal with any asset. IFC Markets and its employees under any circumstances are not liable for any action taken by someone else during or after reading the overview.
