- Analytics
- Technical Analysis
CAD Currency Index Technical Analysis - CAD Currency Index Trading: 2018-11-14
Declining oil prices may weaken the Canadian dollar
In this review, we suggest considering the personal composite instrument (PCI) CAD_Index – “CAD Currency Index”. It falls when the Canadian dollar weakens against the other major currencies. Is there a possibility for CAD_Index prices to decrease?
Hydrocarbons account for about a quarter of Canadian exports. The decrease in world oil prices worsens economic indicators of Canada and negatively affects the Canadian dollar. Additional negative factors were: the next suspension of the construction of the Keystone XL pipeline, which is supposed to transport Canadian heavy crude oil for refining in the USA, as well as a slowdown in the development of industrial production in China. On November 23, important data on inflation for October will be published in Canada. They may affect the decision of the Bank of Canada to keep or raise the rate at its next meeting on December 5.
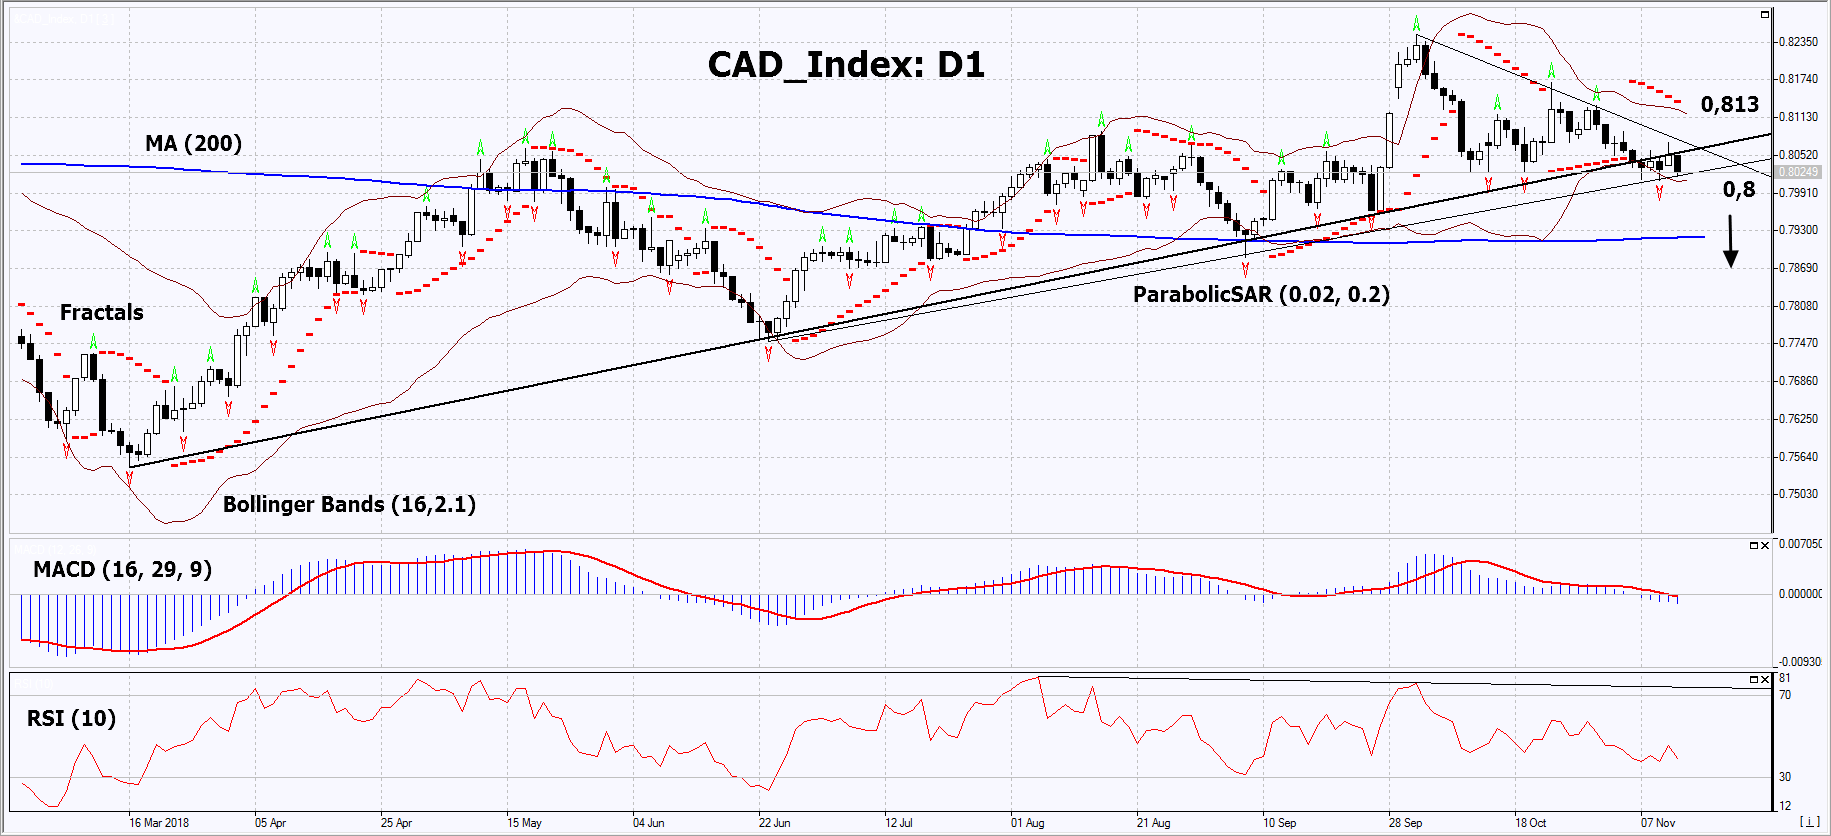
On the daily timeframe, CAD_Index: D1 has breached down the support line of the rising trend. The further price decrease is possible in case of the further reduction in oil prices and preservation of the rate of the Bank of Canada.
- The Parabolic indicator gives a bearish signal.
- The Bollinger bands have narrowed, which indicates low volatility. Both bands are titled downwards.
- The RSI indicator is below 50. No divergence.
- The MACD indicator gives a bearish signal.
The bearish momentum may develop in case CAD_Index falls below its last fractal low and the lower Bollinger band at 0.8. This level may serve as an entry point. The initial stop loss may be placed above the last fractal high, the upper Bollinger band and the Parabolic signal at 0.813. After opening the pending order, we shall move the stop to the next fractal high following the Bollinger and Parabolic signals. Thus, we are changing the potential profit/loss to the breakeven point. More risk-averse traders may switch to the 4-hour chart after the trade and place there a stop loss moving it in the direction of the trade. If the price meets the stop level (0.813) without reaching the order (0.8), we recommend to close the position: the market sustains internal changes that were not taken into account.
Summary of technical analysis
| Position | Sell |
| Sell stop | Below 0.8 |
| Stop loss | Above 0.813 |
- Get Certificate

Note:
This overview has an informative and tutorial character and is published for free. All the data, included in the overview, are received from public sources, recognized as more or less reliable. Moreover, there is no guarantee that the indicated information is full and precise. Overviews are not updated. The whole information in each overview, including opinion, indicators, charts and anything else, is provided only for familiarization purposes and is not financial advice or а recommendation. The whole text and its any part, as well as the charts cannot be considered as an offer to make a deal with any asset. IFC Markets and its employees under any circumstances are not liable for any action taken by someone else during or after reading the overview.
