- Analytics
- Technical Analysis
Australian Stock Index Technical Analysis - Australian Stock Index Trading: 2018-11-09
Improving data bullish for AU200
September trade surplus rose in Australia and the producer price index rose more than expected in third quarter. Will the AU200 recovery continue?
The Reserve Bank of Australia left the interest rate at 1.5% and revised up a little its forecasts for economic growth in 2018 and 2019 at its November 6 meeting. Its central forecast for 2019 and 2020 growth of the Australian economy was upgraded to 3.5%. Recent economic data were positive on balance: the balance of trade surplus rose in September instead of declining as export grew while imports fell. And prices that producers receive for their output rose more than expected in third quarter. The retail sales growth however ticked lower to 0.2% on month in September from 0.3%, but the weak sales reading was in line with the central bank’s forecast. The RBA had noted “growth in household income remains low”. Positive Australian data are bullish for AU200.
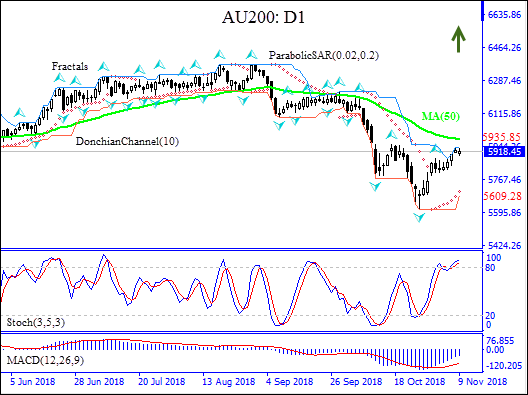
On the daily timeframe AU200: D1 is correcting higher following the decline after hitting 11-year high in the end of August. The price had fallen below the 50-day moving average MA(50) but is approaching to test it now.
- The Parabolic indicator has formed a buy signal.
- The Donchian channel indicates no trend yet: it is flat.
- The MACD indicator is below the signal line with the gap narrowing. This is a bullish signal.
- The stochastic oscillator is in the overbought zone, this is bearish.
We believe the bullish momentum will continue after the price breaches above the upper Donchian boundary at 5935.85. This level can be used as an entry point for placing a pending order to buy. The stop loss can be placed below the last fractal low at 5609.28. After placing the pending order the stop loss is to be moved every day to the next fractal low, following Parabolic signals. Thus, we are changing the probable profit/loss ratio to the breakeven point. If the price meets the stop-loss level (5609.28) without reaching the order (5935.85) we recommend cancelling the order: the market sustains internal changes which were not taken into account.
Technical Analysis Summary
| Position | Buy |
| Buy Stop | Above 5935.85 |
| Stop loss | Below 5609.28 |
- Get Certificate

Note:
This overview has an informative and tutorial character and is published for free. All the data, included in the overview, are received from public sources, recognized as more or less reliable. Moreover, there is no guarantee that the indicated information is full and precise. Overviews are not updated. The whole information in each overview, including opinion, indicators, charts and anything else, is provided only for familiarization purposes and is not financial advice or а recommendation. The whole text and its any part, as well as the charts cannot be considered as an offer to make a deal with any asset. IFC Markets and its employees under any circumstances are not liable for any action taken by someone else during or after reading the overview.
