- Analytics
- Technical Analysis
USD JPY Technical Analysis - USD JPY Trading: 2015-11-23
No further monetary stimulus despite recession
On Thursday the Bank of Japan left the monetary policy unchanged with annual QE volume of 80trn yens. Moreover, other positive news came out. The RSI indicator has formed divergence on the yen chart. Will the Japanese yen continue strengthening?
Some investors have been waiting for the monetary stimulus in Japan to be expanded hoping for the further yen weakening. The Japanese economy has fallen into recession. The GDP for the 3rd quarter decreased 0.2% for the second time in a row but the monetary emission volume was not increased and yen got stronger. On its chart it is seen as the downward movement. The dynamics was supported by the October trade balance surplus of 111.5bn yen which is much better than the expected deficit of 246.3bn yen. Additional positive came from the net volume of the Japanese stocks and bonds acquired by the foreign investors climbing in a week to 573bn yens. Previous week it was 226bn yens. The next important macroeconomic data – inflation and retail sales – will come out in Japan on November 26 and 29.
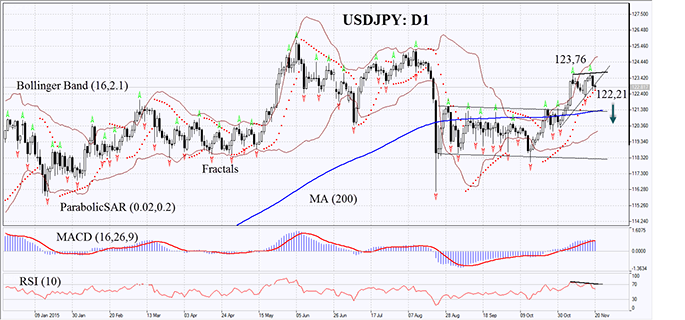
On the daily chart the USDJPY:D1 has broken down the support of the short-term uptrend. It is above its 200-day moving average. The Parabolic indicator gives sell signal while MACD just began forming the sell signal. The RSI indicator has formed the negative divergence. The Bollinger bands have severely widened which means high volatility. The further bearish trend may develop for the yen in case the Japanese currency surpasses the last fractal low at 122.21. The initial risk-limit may be placed below the last fractal high at 123.76. Having opened the pending order we shall move the stop to the next fractal high following the Bollinger and Parabolic signals every 4 hours. Thus, we are changing the probable profit/loss ratio to the breakeven point. The most risk-averse traders may switch to the 4-hour chart after the trade and place there a stop-loss moving it in the direction of the trade. If the price meets the stop-loss level of 123.76 without reaching the order of 122.21, we recommend cancelling the position: the market sustains internal changes which were not taken into account.
| Position | Sell |
| Sell stop | below 122.21 |
| Stop loss | above 123.76 |
- Get Certificate

Note:
This overview has an informative and tutorial character and is published for free. All the data, included in the overview, are received from public sources, recognized as more or less reliable. Moreover, there is no guarantee that the indicated information is full and precise. Overviews are not updated. The whole information in each overview, including opinion, indicators, charts and anything else, is provided only for familiarization purposes and is not financial advice or а recommendation. The whole text and its any part, as well as the charts cannot be considered as an offer to make a deal with any asset. IFC Markets and its employees under any circumstances are not liable for any action taken by someone else during or after reading the overview.
