- Analytics
- Technical Analysis
EUR USD Technical Analysis - EUR USD Trading: 2014-11-05
Euro slumps
Today we consider the EUR/USD currency pair on the D1 chart. At the moment the price is moving within the D1 downtrend channel: we can observe a slight retracement in the daily trend. The descending weekly channel also confirms the bearish trend significance. We have all the confirmations of the price movement from trend indicators: Parabolic historical values are moving along the trend line, and the price touches the lower boundary of DonchianChannel. There is no contradiction on the part of RSI-Bars oscillator: the signal left the downtrend channel area and broke the resistance line downwards (marked in red ellipse on the chart). That gives us an additional signal proving the current trend continuation. We expect the price retracement to be finished when it reaches the fractal resistance level at 1.26080. The current price mark can be used for instant execution order. Stop Loss is recommended to be placed at 1.27793, which is strengthened by the fractal peak and the intersection with the D1 trend line.
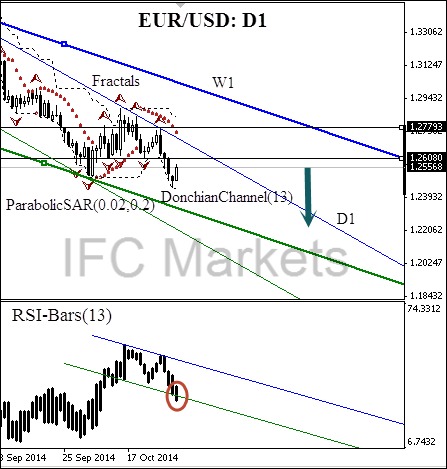
| Position | Sell |
| Sell | current mark |
| Stop loss | above 1.27793 |
Dear traders. You can see the detailed report of the author’s account by clicking here.
- Get Certificate

Note:
This overview has an informative and tutorial character and is published for free. All the data, included in the overview, are received from public sources, recognized as more or less reliable. Moreover, there is no guarantee that the indicated information is full and precise. Overviews are not updated. The whole information in each overview, including opinion, indicators, charts and anything else, is provided only for familiarization purposes and is not financial advice or а recommendation. The whole text and its any part, as well as the charts cannot be considered as an offer to make a deal with any asset. IFC Markets and its employees under any circumstances are not liable for any action taken by someone else during or after reading the overview.
