- Analytics
- Technical Analysis
FUJITSU Ltd. Technical Analysis - FUJITSU Ltd. Trading: 2015-11-24
New products
The Japanese Fujitsu introduced new computer devices and the MetaArc cloud platform. Will it push its stocks up?
Fujitsu has started the sales of its STYLISTIC R726 tablet, the “2 in 1” device combining notebook and tablet and running Windows 10 system. The company introduced today its new Fujitsu CELSIUS workstation and ETERNUS CS data protection appliance. Moreover, the company introduced the MetaArc cloud platform supporting Fast IT. In 6 months of 2015 the Fujitsu revenue almost did not change compared to the same period of 2014, while the company suffered from the operating and net losses. According to forecasts, the Fujitsu net earnings in the fiscal year to March 2016 will contract by 29%. Since the start of the year the company’s stocks lost 4.6% while the Japanese Nikkei edged up 13.9% (have a look at Nikkei live).
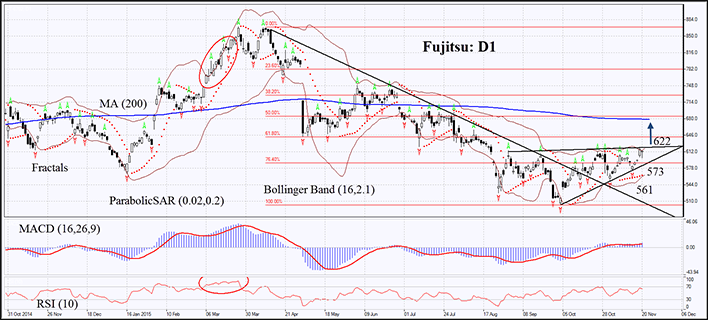
On the daily chart the Т-6702: D1 is consolidated in a triangle having left the downtrend. The MACD and Parabolic indicators give buy signals. RSI is outside the overbought zone, no divergence. The Bollinger bands have contracted which may mean low volatility. The bullish trend may develop in case the Fujitsu stocks surpass the upper boundary of the triangle and the Bollinger band at 622. This level may serve the point of entry. The initial risk-limit may be placed below the Parabolic signal, Bollinger band and the last fractal low at 573 or 561. Having opened the pending order we shall move the stop to the next fractal low following the Parabolic and Bollinger signals every 4 hours. Thus, we are changing the probable profit/loss ratio to the breakeven point. The most risk-averse traders may switch to the 4-hour chart after the trade and place there a stop-loss moving it in the direction of the trade. If the price meets the stop-loss level at 573 or 561 without reaching the order at 622, we recommend cancelling the position: the market sustains internal changes which were not taken into account.
| Position | Buy |
| Buy stop | above 622 |
| Stop loss | below 573 or 561 |
- Get Certificate

Note:
This overview has an informative and tutorial character and is published for free. All the data, included in the overview, are received from public sources, recognized as more or less reliable. Moreover, there is no guarantee that the indicated information is full and precise. Overviews are not updated. The whole information in each overview, including opinion, indicators, charts and anything else, is provided only for familiarization purposes and is not financial advice or а recommendation. The whole text and its any part, as well as the charts cannot be considered as an offer to make a deal with any asset. IFC Markets and its employees under any circumstances are not liable for any action taken by someone else during or after reading the overview.
